Analysis of your web or app traffic is crucial when it comes to making sure your online or app business is on track towards its business goals. Google Analytics is a great free analytics tool offered by Google and is quite extensive on offered features.
Nevertheless, it has been very popular among digital marketers and businesses alike. We’ll look at what Google analytics is, what is it used for, and the various terminologies used commonly along with it.
So, if you are a developer trying to understand Google Analytics basics or a blogger who is looking to use it for tracking traffic to your site or an aspiring digital analyst, hopefully at the end of this article you will be well familiar with Google Analytics.
Why is analytics important?
Before we dive into Google Analytics, let’s have a look at why analysis is important.
As an age-old human behavior- “Analysis” of any task one has done has always helped us gain feedback on what has worked and what has not. Through trial, errors, feedback, and corrections have we learned and progressed far as a human race.
Analysis provides us with valuable feedback that helps us take corrective actions to make sure, we are working towards our defined goals. Analysis also helps us understand various factors that might impact our journey towards our goal.
Analytics for your website, blog, app, or business will help you study various data points, provide you feedback and help you make an informed actions towards improving them.
With Analytics, you can understand your target customers, their behaviors, and thus help solve problems faster.

Rise of digital analytics
Ideally, every business out there tries to analyze their actions, investments and make corrective diversions to their day to day tasks.
If we focus down on Marketing- in particular, has also always tried to analyze the impacts of their various advertising campaigns, how they are acquiring more customers to their businesses, the behavior of their customers as well as how many of their targeted customers convert through the sales department. The point here is, businesses have always relied on analytics even through offline channels.
Now, with the digital revolution, it is no different. Websites, apps acquire customers and help make sales. With this, tracking where do users come from, what they do, and how do they convert, what campaigns and ads worked is getting more and more important on digital platforms. In short, analytics on digital platforms has become a necessity.
There are various providers of Digital Analytics tools in the market. To name a few, Adobe Analytics, SiteImprove, Pendo, Looker, Google Analytics are amongst known.
What is Google Analytics?
To define, Google Analytics is a tracking tool from Google that provides digital marketing analysis such as traffic acquisition, user behavior, events tracking, goals tracking, conversions, etc on a dashboard.
Google Analytics is a free tool offered by Google, while they also have a paid premium version known as Google Analytics 360. More about that later.
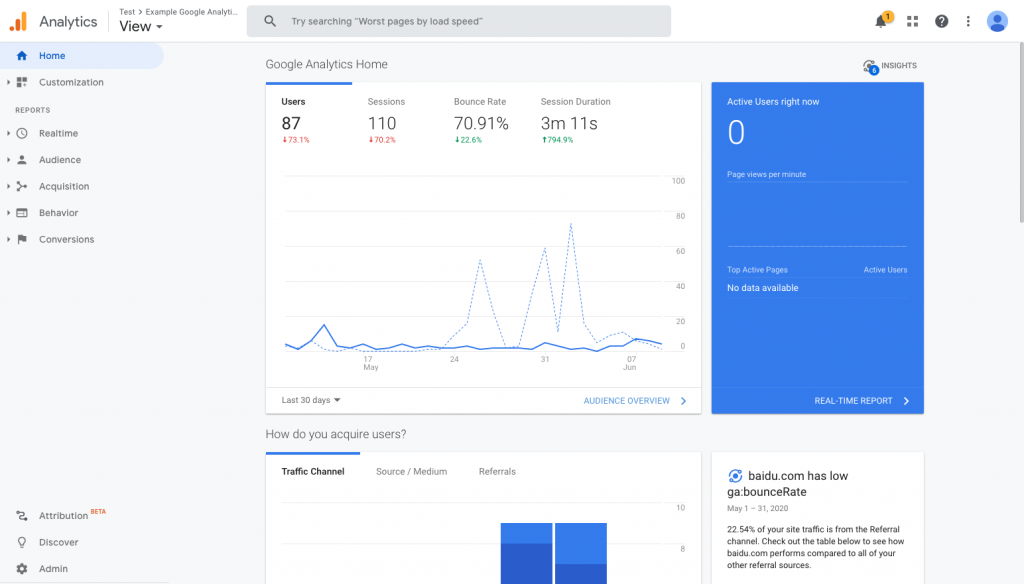
Below is an example Google Analytics dashboard. We’ll get on the depth of this in the latter part of this article.
What is Google Analytics used for?
The main goal of Google analytics is to help it’s users analyze digital behaviors. It is used to track how users visit your digital products, what they do or how they behave, and if they do convert for a sale online.
If you are interested in tracking specific events, like e.g., Do visitors click a certain button on this page of the website, or How long a visitor stays on the website, Google Analytics helps you track custom events as well.
Google Analytics also helps you track custom goals such as e.g., Do visitors follow a certain page route to finally visit a special page? Or Do visitors to my site visit more than one page at a time? And so on..
Google Analytics is primarily used on websites, however, there are various other use cases as well.
Google analytics for websites
The primary use of Google analytics was to track acquisition, visits, behavior, conversions etc on websites.
Websites that are primarily focused on e-commerce or online sales can also benefit from the transaction tracking feature of Google Analytics. One can generate various online sales reports by further slicing and dicing the data into various segments and channels.
Google analytics for bloggers
Google analytics for blogs is no different than Google analytics on other e-commerce based websites. The idea of Google Analytics is to track various data points and bloggers as such would be interested in reports that may not necessarily include online sales but reports on their content consumption.
To give new bloggers a rough idea, here’s a summary of what you could track using Google Analytics.
- You could track, how and through what channels are your readers visiting from and what’s the share of each channel. E.g., Do visitors find you on search engines (also known as organic traffic), or are they visiting you directly by keying in the URL (direct traffic) or they might be visiting you from other sites or referrers and thus referral traffic.
- You could track the landing page your visitors first visit you on.
- Tracking of your visitors return to read more content is possible.
- You could track custom events such a readers reading more than two articles on the blog.
- You could track goals and funnels like readers signing up for newsletters and much more.
Google analytics for Mobile Apps
Besides websites, Google Analytics can also be used to track the behaviors of users on mobile phone apps.
By integrating Google Analytics on Android or iOS apps one can understand the number of users of their app, the user’s acquisition, and their characteristics.
You can measure the various actions users perform inside the app, any in-app payments made, visualize their navigation paths towards actions, further slice dice the date into various segments and channels to understand your app’s user behavior, and further improve your app experience.
Google analytics for point of sales units
Google analytics on point of sales units at your retail outlet or supermarket is also possible but not many are aware of this feature.
This feature can help one’s business push data from the kiosks or point of sale machines back into Google analytics dashboard, where one could mostly analyze the sales data along with other website or app data if available.
This is achieved using Measurement protocol offered by Google Analytics. The kiosks or point of sales devices need to be Internet-connected to make sure that they can ping the data to Analytics servers.
How does google analytics work?
Google Analytics works with the help of a JavaScript-based tracking code that’s embedded in the website or app.
The website or app owner is provided with an analytics code which is then embedded in the header of the website or appropriately in the app code. This code should be triggered on all pages so that one has accurate tracking reports.
Whenever a visitor visits your site or app, the script embedded in the code executes and then records the visitor’s activity. This data is then reported to Google Analytics servers, where it is processed and then finally available in your view under the Google Analytics dashboard.
![]()
How to install google analytics?
The basic idea of installing Google analytics is nothing but to make sure the tag provided on the Google Analytics dashboard is embedded in every page on the website.
There are other ways of installing Google analytics using a tag manager as well. A detailed post on explaining what is tag manager and how to install Google analytics using the tag manager can be found here. If you are not using a tag manager or just getting started with basics of Google analytics, please read on.
1. Sign up for the tool
To get started with embedding Google Analytics, head over to analytics.google.com and sign up. You could use your existing Google account as well. You can then later also share or grant access for your Google analytics views to other Google account users.
The user signing up will be the owner of the Analytics account, so it is best that the owner creates one and then grant access to others if the owner needs any help with analysis or setup. Do note, one can also grant admin rights to other accounts later, if needed.
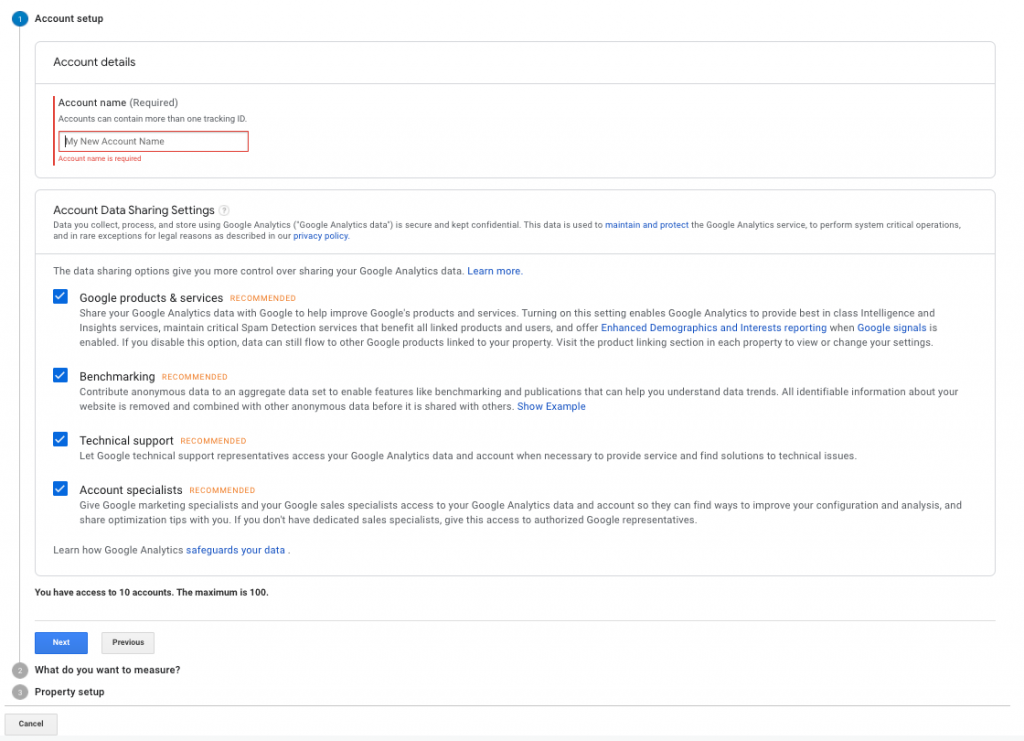
2. Set up the account and property
Let’s begin with how accounts and property are structured in Google Analytics. As a Google Analytics user, one has created up to 100 Google Analytics account under one Google account.
An account could refer to your organization.
Within an account, one can create unto 50 properties. A property refers to any website or app you are tracking.
Further inside a property, one can create up to 25 views. Views are ways to see various tracking data inside a property. See more details in Image A below.
E.g., If you intend to track analytics for two different organizations owned by the same Google user, you would go about creating 2 separate accounts, one for each organization and then a property within each account. Example in Image B below.
However, say if you as a Google User own two websites or a website and an app, but both are owned by the same organization, you could create one Account and then two different properties inside the account. Example in Image C below.

Now, let’s proceed with creating your accounts and properties in Google.
Once you have entered the account name, you can then choose if you would be tracking a website, app, or both and then proceed to create the Property.
In the example below, we have chosen a web property and then entered the website name and the URL.
3. Grab the tracking code
Once the property is set, Google analytics will hand you over a tracking code. This code will be the one that helps us track our property (website or app) and then report data to Google Analytics servers.
Let’s analyze the code which looks like something below.
An ID followed by UA-“XXXXX” is your tracking ID. This is also known as the Google Analytics account tracking ID. Other commonly referenced terms for this ID is Property tracking id/ Analytics id/ Web Property id/ Google analytics account number etc.
    <!-- Global site tag (gtag.js) - Google Analytics -->
    <script async src="https://www.googletagmanager.com/gtag/js?id=UA-xxxxxxxxx-x"></script>
    <script>
      window.dataLayer = window.dataLayer || [];
      function gtag(){dataLayer.push(arguments);}
      gtag('js', new Date());

      gtag('config', 'UA-xxxxxxxxx-x');
    </script>
Note: If you plan to use plugins or other managers to embed analytics, especially on WordPress or some other CMS sites, they seek only the UA ID and not the whole code provided to you. You’ll have to make sure if you need to just key in the UA Google Tracking ID or the whole code on your website.
4. Insert the tracking code on your site
Now once you have the code, it is time to insert it into every possible page on the site or property that needs to be tracked. Below are some examples of how to go about inserting Google Analytics tracking code in most scenarios.
a) Inserting the tracking code on a website
If you have a website that is completely HTML based, you’ll have to make sure this code is added in the head element on every page.
Some developers, architect their site structure as separate components. E.g., One could write a header file only once and then inject this header file on every possible page. That way, if you make changes to one header file, it is rendered on every possible page which embeds this header file. In such cases, you’ll have to inject the Analytics code only once in the header file, and since every other page calls this header file, the analytics code is rendered on each one.
e.g., Sample HTML with analytics code
     <html>
    <head>
    .....
    ....
    ...
    INSERT THE COMPLETE GOOGLE ANALYTICS CODE HERE.
    </head>
    </html>
b) Inserting the Google analytics tracking code on a WordPress website using plugin.
If you are a WordPress user and completely new to code, chances are you might rely on plugins for installing Google Analytics or your WordPress theme might have a way to inject the tracker. Fair enough!
In such cases, the plugin you install or the theme you use may either require to type out the complete tracking code or may just require you to enter the UA-xxxxx ID.
c) Inserting the Google analytics tracking code on a WordPress website without plugins
If you are an experienced developer or someone who could dig into the WordPress code, you could easily embed the code directly to your WordPress site, without using plugins.
Make sure you backup your site/ themes before you proceed with this. Using a child theme is always recommended as any future updates or changes to the parent theme will not destroy your customizations.
If you do not know what a child theme is, I’ll try and explain it in short below. However, if you do know what a child theme is, you can skip to the next paragraph. A child theme is another layer of code over the parent theme of a WordPress site. What a child theme does is to copy some component files from the parent theme. An end-user then can make changes to this child theme. In the future, whenever the core theme is updated, the child theme will remain untouched. Whenever WordPress tries to render your website, it looks for file components inside a child theme, if available uses that or only then goes to fetch the file from the parent theme. So in this case, we’ll make sure we make a copy of header.php from the WordPress theme file into our child theme.
Now head over to theme editor and look for header.php file, which should ideally have your head tag for the theme. All you’ll have to do is paste the whole tracking code before the end of tag in the file. Remember to save the file and then reload your WordPress site.
The google analytics tag should now be available on your WordPress site without the help of plugins.
Now, that’s done, your website or blog should be now able to start tracking visitors. To make sure, everything is right, you could check the real-time view under the Google Analytics dashboard.
Head over to your google analytics dashboard of the newly created account and click on the Realtime, Overview tab. Make sure you refresh your website in a different tab (to ensure you have visited the site) and give it a couple of minutes. If All is well and analytics tracker is not blocked- the real-time view in Google analytics should increase the count!
Joy to your world, the real-time tracker has sung!

Now that your Google Analytics tracking is in, follow along to know more tips on how you should organize your Google analytics views and various other common terminologies used.
5. Why you should create a new view in your Google Analytics property
As we read earlier, every property in your Google Analytics account can have up to 25 views. Views are nothing but a filtered way of looking at your data.
Of course- you could just start looking at the default view in your analytics and nothing could go wrong. But ideally, for better organization purposes, we would recommend about three views on your new Google Analytics property.
Before we dig deeper, let’s have a glance at how Google Analytics processes data. Once the data is pushed by the tracker to the server, the data is processed by the Analytics server. It then runs through your view settings and only then available for you to consume.
In other words, the data was passed through the view before you could see it. That means, if you set up any filters in your default view to exclude all the traffic coming from a bot or a certain IP address- that’s lost forever!
So the ideal thing to do would be to leave the default view as it is without any filters so as to make sure you always have access to RAW data.
After creating new views, you could always apply desired filters like excluding known bots traffic so that false data is not presented to you for your analysis.
Here’s how you create a new view in Google analytics.
Head over to the Admin section on the left-hand navigation bar and then hit Create New View. Here, you can also see various filters you could apply to your view.
The three Google analytics views we recommend for a new property are as below.
- The default view: Leave this as it is for RAW data
- A test view: To test any filter or experiments you need to do before you apply anything on your Daily use view
- The processed data View: This will be your day to day usage view.
Of course, you can go ahead and create more views based on your business requirements such as View based on certain countries or certain segments of your website such as Blogs only, etc.
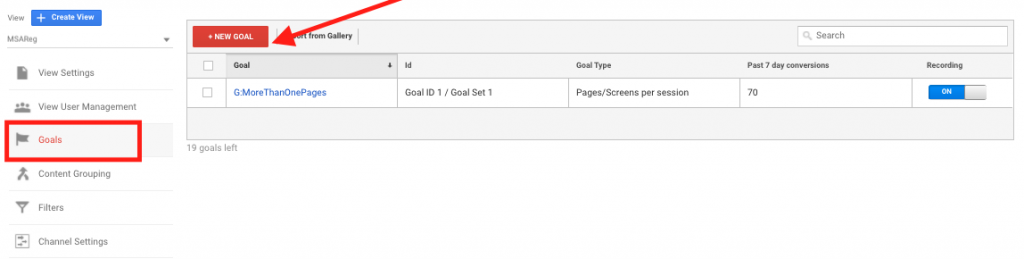
How to set up goals in Google Analytics
Goals are a way to track events or certain sequences of events in your Google Analytics account.
E.g., If I would like to track, How many visitors visit the Home Page of this site and then visit the Google Analytics blog post, I could track this sequence as a Goal. Anyone who visits the home page, then visits a different page and then finally visits this blog post, may not be counted under Goals based on your settings.
To create Goals, head over to the Admin section on the bottom left corner of the dashboard navigation bar. Now Under View, select the appropriate view where you would use this Goal. And then hit Goals.
Now, you can click Create New Goal and fill in all the conditions of your Goal. Hit save and the Goal is ready to be tracked. Ideally, you could also test the Goal on the existing data you have.
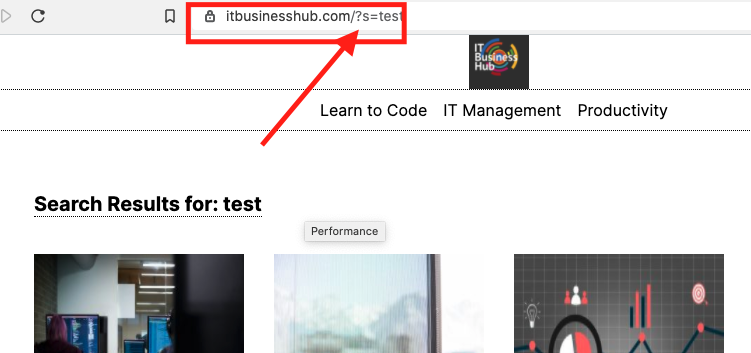
How to set up site search in Google Analytics
If your website or blog has a built-in search feature that allows users to search within the website, then you could track these search queries in Google analytics.
To do this, head over to your website and search for something. This is so that you can grab the URL for search and provide these parameters to Analytics.
E.g., On this site the search starts with ?s=xyz or ?s=abc
The parameter “s” is used to determine the term being searched. It could be different from site to site.
Now head over to Admin (on left-hand corner) and then select the View you need to add search settings to. Inside the view settings, switch on the Search settings and then provide the query term.
Which is “s” in my site’s case.

How to share Google analytics view to other users.
As a user with rights to share access to your Google Analytics, you can grant them to other analytics users. The rights granted can be to the Account Level, Property Level or View Level.
If you grant someone access to the Account, they have access to Property as well as View and so on.
To share access, head over to Admin and then select User management in either Account or Property or View. Once you click the User Management, you can then add an email ID for the recipient’s Google Account and then grant appropriate access.
The four levels of access are:
- To edit: One can edit Filters, goals, etc. however can not grant access to other users.
- To collaborate: One can collaborate with other analysts by creating reports, edit dashboards etc but can’t grant access to other users.
- Read and analyze: This access allows the users to read and download all the analytics data for analysis purposes. They can’t create any new reports or goals or grant access to other users.
- Manage Users: The users with this access can then add, modify or delete users to the account, property, or view.
Various built-in reports in Google analytics.
Google Analytics has various built-in reports and in this section, we’ll have a look at what each report can do for you and what data can be looked up.
The three main sections or ABC of Google analytics are:
- Acquisition & Audiences
- Behavior
- Conversion
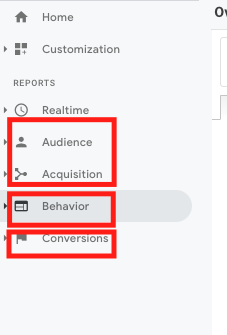
Along with the ABCs, we also have Real-Time reports in Analytics.
Let’s have a look at some of the important reports under each section.
Audiences Report in Google analytics
- Audiences: Under the Audiences report, you can have a look at Users and sessions to your website or app. This section gives you information about new users versus returning users and the number of sessions they are in for on your tracked website or app.
- User Explorer: Under user explorer, you could see how an anonymous user performed on your site and various actions taken on the website by a specific user.
- Demographics: Under the demographics section of Google Analytics, you can view details like age and gender of your website’s audiences.
- Interests: This section will provide you more ideas about the interests of your website audience and how you could consider targeting them better.
- Geo: Under Geo, one could know more about where in the world your audiences are coming from. This includes data like country and cities as well as language based on their browser or device settings.
- Behavior: Behaviour under Audiences section provides you an overview of new vs returning users and engagement frequencies.
- Other prominent reports in sections are Technology and devices, where you could study some data about the technology used by your audiences. This way you can make sure your website or app runs perfectly on the one used by the majority of your audience.
Acquisition Reports in Google analytics
- All traffic: Under this section, one can understand how users are finding your website and what is acquiring these users. This section includes information about various channels they visited from, the source and medium, and any referrals that other websites or apps have sent traffic to your site.
- Google Ads: If you plan on using Google Ads, this can be integrated with Analytics to analyze the acquisition due to ads under this section.
- Search Console will show you data if you have connected the Google Search console or Webmasters tool appropriately.
- Social shows all traffic acquired from social media and Campaigns will show traffic acquired from any custom campaigns you have set up.
Behavior Reports in Google analytics
Under this section, you will find all data related to the behavior of your users on the website or app.
- Behavior Flow: Shows you a graphical path most users take on your site
- Site Content: Under this section, you’ll find details about all the pages visited by your audiences, landing pages as well as exit pages, or the last page they viewed before they left your website.
- Site Speed: Reports under Site speed lets you analyse the the page load speed, some suggestions to improve site speed, etc.
- Site Search: This is of interest if you have enabled Search within your website. You’ll also have to make sure the search logs settings under view details (in admin area) have been configured. You should find search terms and pages searched for by your users in these reports.
- Events: This section includes any events you have started tracking on your site.
Conversion Reports in Google analytics
- Goals: If you have set up any Goals on the site, then all such data will be recorded under this section.
- E-commerce: Under this section, you’ll find data related to any transactions on your site, if you have set them up. This includes product performance, sales, transaction data as well as time required by your audiences until they finally purchase on your site.
How to export data from Google Analytics.
One can export data from Google Analytics for offline analysis.
To export data, select the appropriate report with the appropriate date. Then hit the export button on the top right hand of the page.
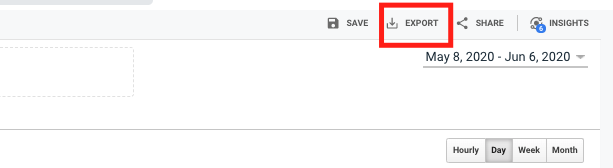
The various options to export data from Google Analytics are:
- Google Sheets
- Excel
- CSV
If you need more sophisticated real-time exports and reporting, one could look at connecting Google Data Studio to Google analytics or use tools like Supermetrics to export data.
How to start tracking campaigns using Google Analytics
If you intend to start tracking specific campaigns in Google Analytics, you’ll have to embed some data on your links. These links can then be used in your emails, other websites, or within your website.
Users who click this link then feed those parameters to Google analytics and thus this information is available under Campaigns under Acquisition reports.
An example of campaign tracking link would look like: Your URL / utm_campaign=”EnterCampaignTermHere”&utm_medium=”EnterMediumHere”&utm_term=”EnterTermHere”.
Google has provided a tool, where you could enter the specific terms for tracking your campaigns and it should generate the link for you. Find the Google Campaign URL Generator here.
What is Google analytics 360 or Google analytics premium?
Google Analytics 360 or Google analytics premium is a paid version of Google analytics offered by Google to Enterprise Customers.
Google Analytics 360 includes advanced tools like Unsampled data, Exporting using Big Query, and Data-driven attribution. If your business also requires a Service Level Agreement that covers higher processing limits of data and data freshness, Google Analytics 360 includes it. Know more about Google analytics 360 here.
Can google analytics be blocked?
Yes, Google Analytics can be blocked. There are various ways like using Browser plugins as well as certain browsers that help you block Google Analytics.
One might need to block Google analytics to make sure, you are not artificially inflating traffic to your site or for privacy purposes. If your site uses Google Analytics, it is a good idea to include this clause under your Privacy policy or Terms and Conditions.
Google also offers a tool to users who might want to opt out of Analytics tracking here.
What is Google analytics certification?
If you would like to learn more about Google analytics as well as form a career in Data analysis, Google does offer a course as well as certifications.
Google Analytics Certification proves your knowledge of Google Analytics to potential hiring businesses. It is an online test, where one is tested for his or her understating on Google analytics. If you are interested, you can study more on Google Analytics here.
Hopefully, this article has helped you understand the basics of Google analytics and get you started. Do consider sharing this article, if you found it useful. :)
Thanks for reading! Happy Analysing!